We need functions to avoid the repetitive same few lines of code.
R functions are treated much like any other R objects.
Like in JavaScript language the functions can be passed as arguments and it can be nested too. The functions are defined using the function() directive.
> func <- function(){
+   ## Body of the function [empty]
+ }
> class(func) ## Identify the class type
[1] "function"
> func() ## Execute the function
NULL
function arguments are another important option for a function.
> func <- function(num){ ## pass the num argument
+   for (c in num) {
+     cat("function reduces the # of code\n")
+   }
+ }
> func(1:3) ## Execute the function
function reduces the # of code
function reduces the # of code
function reduces the # of code
We can modify our code a bit by setting a default value for the arguments. Therefore we can call the function without passing any argument value to the interface.
> func() ## Execute the function
Error in func() : argument "num" is missing, with no default

> func <- function(num=1:2){ ## pass the num arguments
+   for (c in num) {
+     cat("function reduces the # of code\n")
+   }
+ }
> func() ## Execute the function
function reduces the # of code
function reduces the # of code
Lazy Evaluation
Function arguments are evaluated lazily. The below code example clearly explains it.
> add <- function(a, b){ ## Evaluated lazily
+   cat(a)
+ }
> add(3) ## Passing one argument value
3
When both arguments are used in the body then R will check for the next argument too.
> add <- function(a, b){ ## Evaluated lazily
+   cat(a + b) ## Both arguments are used
+ }
> add(3) ## Passing one argument value
Error in cat(a + b) : argument "b" is missing, with no default
Arguments with ‘…’
In R we can find a special argument … , which indicate a number of arguments that are usually passed on to other functions. The … argument is often used when extending another function.
> plot ## Execute to see the arguments
function (x, y, ...)
UseMethod("plot")
<bytecode: 0x10195dad0>
<environment: namespace:graphics>
>
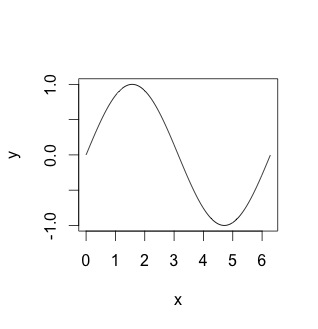
> myplot <- function(x, y, type = 'l', ...){
+ plot(x, y, type = type, ...) ## pass '...' to plot function
+ }
>
> ## Create the x, y points to plot
> x=seq(0,2*pi,0.01)
> y=sin(x)
>
> # Draw the plot graph [Figure 1]
> myplot(x,y)