It’s been a while now; I couldn’t post anything in my blog. Last year was great but I know I couldn’t finish my Akka blog series. But I will make sure to finish it by this year.
In 2016, I faced so many challenges within this couple of months and I learnt a lot of scientific things in information theories. It was not very easy task for me. In one point I lost my spirit but I always knew one secret,
‘If you can’t find the answer just leave it for the moment everything will fall in to places at correct time’.
I will make sure to post the scientific research I did with some easy practical scenarios that will help to understand easily.
Even my focus was changing in several times the interest that I had towards data has not been decreased. So lets learn something new this year to get a better understanding about the data. One of the interesting tools used by data scientists are R language. R is a language and environment for statistical computing and graphics. Basically it will allow us to learn about the data/data pattern and to get some decision about the data by looking at the graphs.
Learning Guide

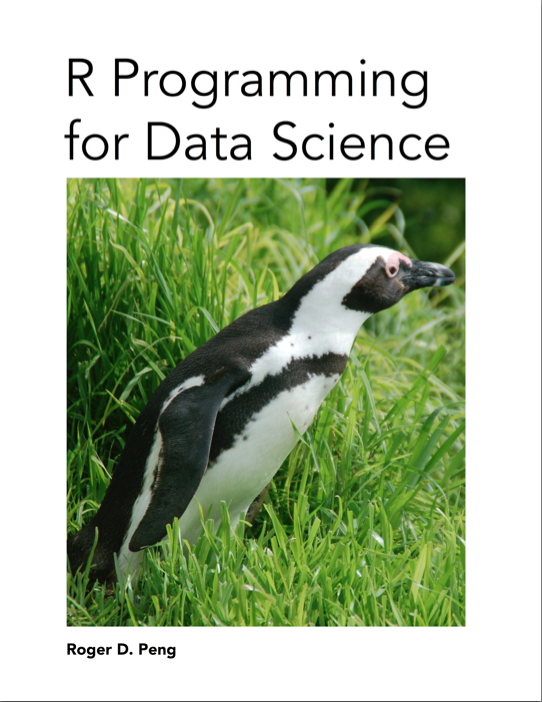
Last year I started to read this book and I totally loved it. The explanation and the guide they provided in ‘R Programming for Data Science’ by Roger D. Peng is commendable. I will recommend this book for all the beginners to this language. He makes our life so easy ☺. Before delve into depth of R-Programming lets start with our mandatory Hello World program using R language in my next post on R language series.